The Importance of On-Chain Analysis in Crypto Trading: How Blockchain Data Gives You an Edge

Crypto trading isn’t just about reading charts or chasing hype. The real pros know that on-chain analysis can offer deep, data-driven insights that regular technical analysis simply can’t.
On-chain analysis allows you to track real blockchain activity—things like wallet movements, token flows, and network usage. This gives you a powerful edge in predicting market behavior before the charts react.
In this article, we’ll explore what on-chain analysis is, how it works, and how you can use it to make smarter, more informed crypto trades.
What Is On-Chain Analysis?
On-chain analysis is the process of examining public blockchain data to evaluate market sentiment and investor behavior.
Since blockchains are transparent, you can analyze:
- Wallet addresses and balances
- Large fund transfers
- Exchange inflows and outflows
- Miner and whale behavior
- Network health and activity
This raw data is public and cannot be manipulated, making it a trustworthy way to gain market insights.
Why Is On-Chain Analysis Important?
While technical analysis focuses on price movements and chart patterns, on-chain data shows what’s happening behind the scenes.
Here’s what makes on-chain data powerful:
- It reflects real investor behavior, not just market speculation
- It’s transparent and trackable, straight from the blockchain
- It offers early warnings before major moves happen
- It helps detect accumulation or dumping from whales
- It reveals long-term market strength or weakness
Key Metrics in On-Chain Analysis
Let’s look at the most important on-chain indicators and what they reveal:
1. Exchange Inflows/Outflows
- Inflows to exchanges usually mean users are preparing to sell (bearish)
- Outflows often mean accumulation or cold storage (bullish)
2. Wallet Activity
- New wallet creation indicates growing adoption
- Dormant wallet activation may signal selling pressure or old whales moving coins
3. Whale Tracking
- Monitoring large addresses (holding >1,000 BTC, for example) shows if big players are buying or selling
4. Realized Profit and Loss
- Tracks how much profit or loss investors are taking based on past purchase prices
5. Network Value to Transactions (NVT) Ratio
- Compares market cap to daily transaction volume
- High NVT = overvalued; Low NVT = undervalued
6. MVRV Ratio (Market Value to Realized Value)
- Shows how far current prices are from the average buying price of holders
- Used to find tops and bottoms in the market
Also Read: What Is On-Chain Analysis? A Complete Beginner’s Guide
Real-World Example: Using On-Chain Data to Predict Price Moves
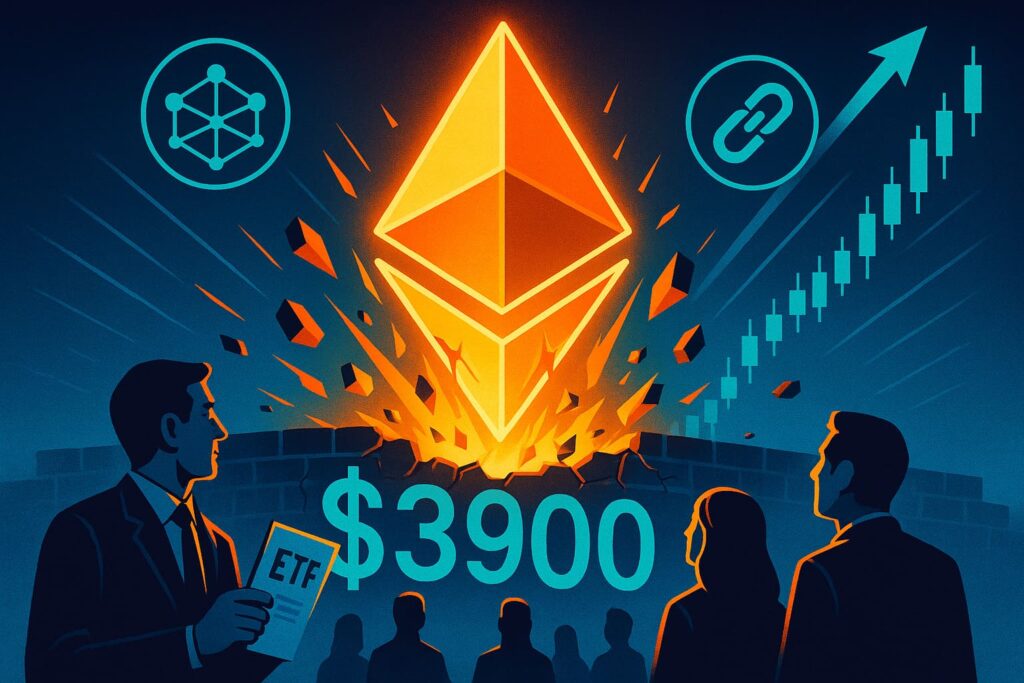
Let’s say Ethereum is trading sideways, but on-chain data shows:
- Massive ETH outflows from exchanges
- Whale wallets accumulating ETH
- Increase in staking activity
Even without a breakout on the chart, this bullish on-chain activity could indicate an upcoming rally.
In contrast, if you see:
- Heavy inflows to exchanges
- Large wallets selling
- Decreasing network activity
That could signal a correction or downtrend, even if price is still high.
How to Access On-Chain Data
There are several tools and platforms that provide real-time on-chain data:
- Glassnode – Great for BTC/ETH metrics
- CryptoQuant – Exchange flows, miner stats, and whale alerts
- Nansen – Tracks wallet behavior and smart money movements
- Dune Analytics – Custom dashboards for DeFi projects
- Arkham – AI-driven wallet intelligence
Most of these platforms offer free dashboards, but pro traders often pay for advanced features.
Tips for Using On-Chain Data Effectively
- Combine with TA: On-chain signals are strongest when they align with technical patterns
- Look at trends, not just snapshots: A one-time whale move isn’t as telling as consistent behavior
- Watch for divergence: Price going up while on-chain metrics weaken? Be cautious
- Don’t trade headlines: Always verify data using platforms like Glassnode or Nansen
Summary: Blockchain Data Is Your Trading Edge
On-chain analysis offers a clear, unfiltered view of crypto market activity. It helps you trade based on what’s actually happening on the blockchain—not just what the charts or influencers say.
In a market full of noise, data-driven trading decisions can make all the difference.
If you’re serious about becoming a better crypto trader, learning on-chain analysis is no longer optional—it’s essential.


