Everything You Need to Know About Support and Resistance in Trading

The Foundation of Market Analysis
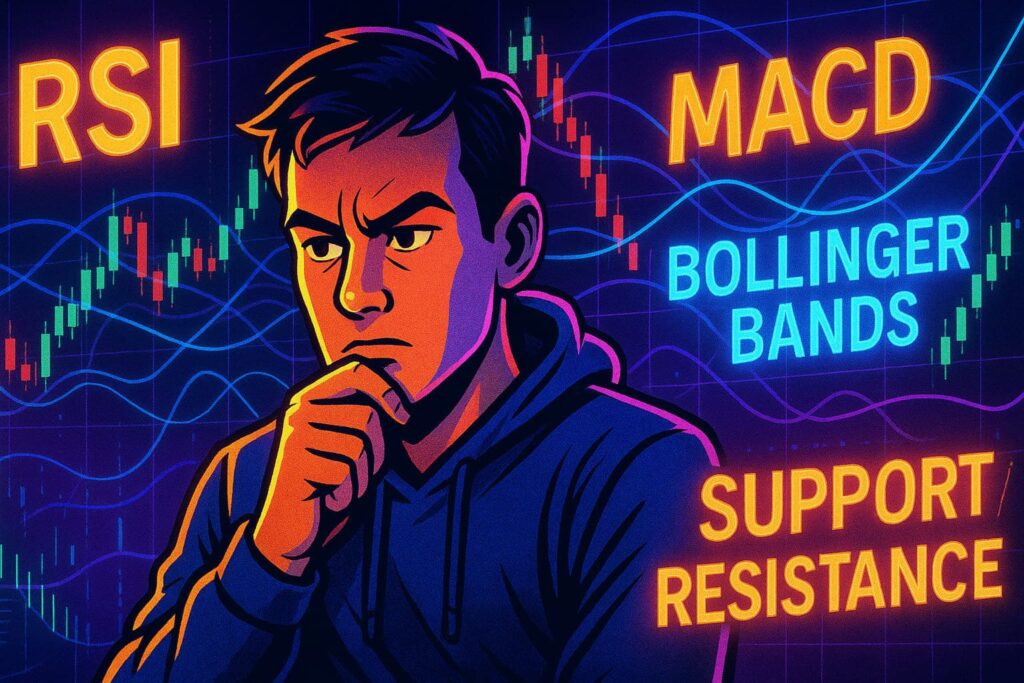
Support and resistance are two of the most fundamental concepts in trading, whether you’re dealing with stocks, forex, or cryptocurrencies. They help traders identify potential price reversal points, improving decision-making for entries, exits, and stop-loss placements.
When understood correctly, support and resistance can be powerful tools for predicting market behavior. This guide will break down what they are, why they matter, how to identify them, and how to use them effectively in your trading strategy.
What is Support?
Support is a price level where an asset tends to stop falling and may even reverse upward. It represents a concentration of buying interest strong enough to prevent the price from declining further.
Why support forms:
- Traders and investors see the asset as undervalued at that price.
- Large buy orders are placed, creating demand.
- Psychological levels like round numbers act as natural support zones.
Example: If Bitcoin repeatedly bounces upward after hitting $30,000, that level becomes a recognized support zone.
What is Resistance?
Resistance is the opposite of support. It’s a price level where upward momentum slows or reverses as selling pressure outweighs buying demand.
Why resistance forms:
- Traders take profits at certain price points.
- Sellers dominate when an asset feels overvalued.
- Historical price peaks create psychological barriers.
Example: If Ethereum repeatedly fails to move above $4,000, traders may consider it a strong resistance level.
How to Identify Support and Resistance Levels
There are several ways traders identify these key levels:
Historical Price Levels
Look at past charts — areas where price has reversed multiple times are strong candidates.
Trendlines
Connecting swing highs or swing lows can reveal diagonal support or resistance.
Moving Averages
Long-term moving averages (50-day, 200-day) often act as dynamic support or resistance.
Fibonacci Retracement Levels
Widely used in technical analysis to predict potential reversal zones.
Volume Profile
High trading activity at certain price levels can create strong zones.
The Role of Support and Resistance in Market Psychology
Support and resistance work because of crowd psychology. Traders remember where prices have previously reversed and act accordingly. This creates self-fulfilling patterns:
- At support levels, buyers step in expecting a bounce.
- At resistance levels, sellers act anticipating a drop.
In crypto, this effect can be even stronger due to high retail participation and emotional trading.
Types of Support and Resistance
- Horizontal: Fixed price levels visible on charts.
- Dynamic: Moving averages or trendlines that shift over time.
- Psychological: Round numbers like $1,000 or $50,000.
- Pivot Points: Calculated levels used in day trading strategies.
How to Trade Using Support and Resistance
Buying at Support
Enter long trades when the price bounces from a known support level. Place stop-loss slightly below it.
Selling at Resistance
Enter short trades or take profits when the price stalls near resistance. Place stop-loss slightly above it.
Breakouts
If price breaks through resistance with high volume, it may signal a strong uptrend. Similarly, a breakdown below support can trigger a downtrend.
Role Reversal
When support is broken, it often becomes resistance, and vice versa. This is a key concept for trend-following traders.
Common Mistakes to Avoid
- Assuming support or resistance will hold every time.
- Ignoring market news and fundamentals that can break levels.
- Not adjusting stop-loss when trading volatile markets like crypto.
- Over-relying on one method without confirming with other indicators.
Why Support and Resistance Are Not Absolute
No level is 100% guaranteed to hold. Prices can temporarily break through due to “stop hunts” or market manipulation before resuming the expected trend. This is why risk management is essential when trading these levels.
Takeaway
Support and resistance are essential tools for traders looking to improve accuracy and timing in the markets. By learning to identify these zones and understanding the psychology behind them, you can make more informed trading decisions and manage risk effectively.
Combine them with other technical indicators and market fundamentals for the best results — and remember, no strategy is foolproof without proper discipline.


