


30+ Must-Know Technical Analysis Terms Every Crypto Trader Should Master

In the world of crypto trading, technical analysis (TA) is one of the most powerful tools at your disposal. It helps you understand price trends, identify entry and exit points, and manage risk with confidence.
But if you’re new to TA, all the charts, indicators, and lingo can feel overwhelming.
That’s why we’ve created this simplified glossary of 30+ essential technical analysis terms—explained in plain English—so you can trade like a pro without getting lost in the jargon.
Core Concepts
1. Technical Analysis (TA)
A method of analyzing price charts and indicators to predict future market movements.
2. Price Action
Movement of an asset’s price on a chart—without relying on indicators. Traders use it to read market sentiment.
3. Trend
The general direction of the market (uptrend, downtrend, or sideways).
4. Support Level
A price level where a falling asset tends to pause or bounce upward.
5. Resistance Level
A level where a rising asset tends to stall or reverse downward.
Chart Types & Patterns
6. Candlestick Chart
The most used chart type in crypto trading. Each “candle” shows open, high, low, and close prices for a time period.
7. Line Chart
A simple chart showing closing prices connected by a line—good for quick overviews.
8. Chart Pattern
Shapes formed by price movement on charts that can signal trend continuation or reversal (e.g., head and shoulders, triangles).
9. Double Top / Double Bottom
Patterns that signal potential reversal. Double top = bearish; double bottom = bullish.
10. Cup and Handle
A bullish continuation pattern that resembles a teacup on a chart.
11. Flag & Pennant
Short-term continuation patterns formed after strong price movements.
Indicators & Tools
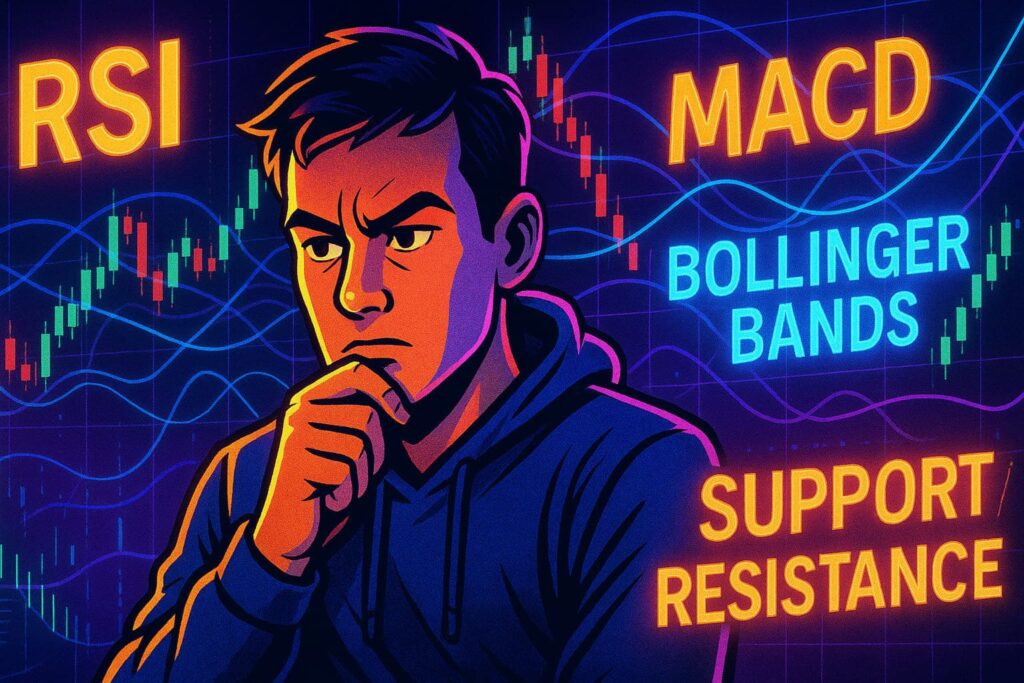
12. RSI (Relative Strength Index)
A momentum indicator showing whether an asset is overbought (>70) or oversold (<30).
13. MACD (Moving Average Convergence Divergence)
Measures momentum and trend strength using two moving averages.
14. Bollinger Bands
Bands around price that expand and contract based on volatility. Price hitting bands can signal overbought/oversold zones.
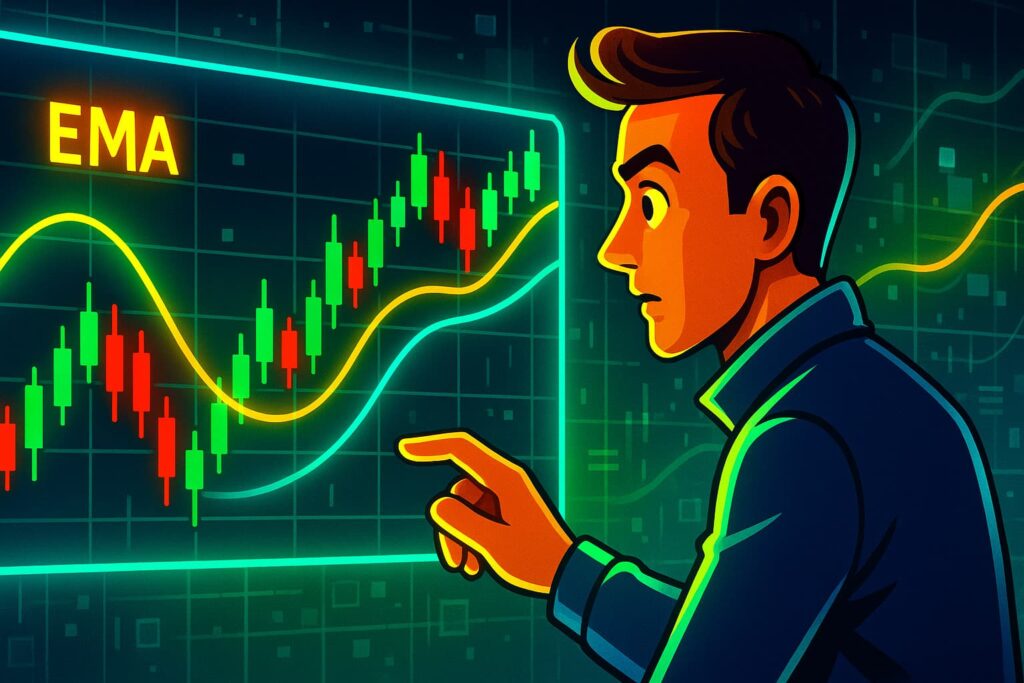
15. Moving Average (MA)
Shows average price over a time period. Can be simple (SMA) or exponential (EMA).
16. EMA (Exponential Moving Average)
A faster-moving average that gives more weight to recent prices.
17. SMA (Simple Moving Average)
An evenly weighted average of prices over a specific time period.
18. Volume
Measures how much of an asset is traded over a period. High volume confirms strong moves.
19. VWAP (Volume Weighted Average Price)
Shows the average price weighted by volume—used by institutional traders.
Oscillators & Momentum Tools
20. Stochastic RSI
Combines RSI and Stochastic oscillator to show momentum shifts more precisely.
21. CCI (Commodity Channel Index)
Identifies cyclical trends in the market. Above +100 = overbought; below -100 = oversold.
22. ADX (Average Directional Index)
Measures trend strength—values above 25 suggest a strong trend.
23. ATR (Average True Range)
Shows market volatility—higher ATR means higher risk/reward.
24. Momentum Indicator
Measures the speed of price movement. Used to confirm trend direction.
Fibonacci & Drawing Tools
25. Fibonacci Retracement
Horizontal lines showing possible support/resistance at 23.6%, 38.2%, 61.8%, etc., based on the Fibonacci sequence.
26. Trendlines
Lines drawn on a chart to connect highs or lows and identify trend direction.
27. Channels
Parallel lines drawn to contain price action within a trend.
28. Breakout
When price moves above resistance or below support, often signaling strong momentum.
29. Fakeout
A false breakout that quickly reverses and traps traders.
Risk Management & Strategy Terms
30. Stop Loss
A predefined price level at which a trade is automatically closed to prevent further loss.
31. Take Profit
A target price where your trade is closed automatically to secure gains.
32. Risk-to-Reward Ratio (R:R)
The ratio of potential gain to potential loss in a trade. A good R:R is usually 2:1 or higher.
33. Entry/Exit Point
The price level where you start or close a trade based on analysis.
34. Confirmation Signal
An extra indicator or chart pattern that strengthens your decision to enter a trade.
Summary: Speak TA Like a Pro
Learning technical analysis doesn’t mean you need to memorize every indicator or chart pattern. But understanding these 30+ essential terms will give you the confidence to:
✅ Read charts accurately
✅ Build your own trading strategy
✅ Avoid emotional trades
✅ Talk the language of pro traders
Practice by applying a few indicators at a time on real charts using demo trading platforms like TradingView.
The more familiar you become with TA terms, the better your trading decisions will be.