


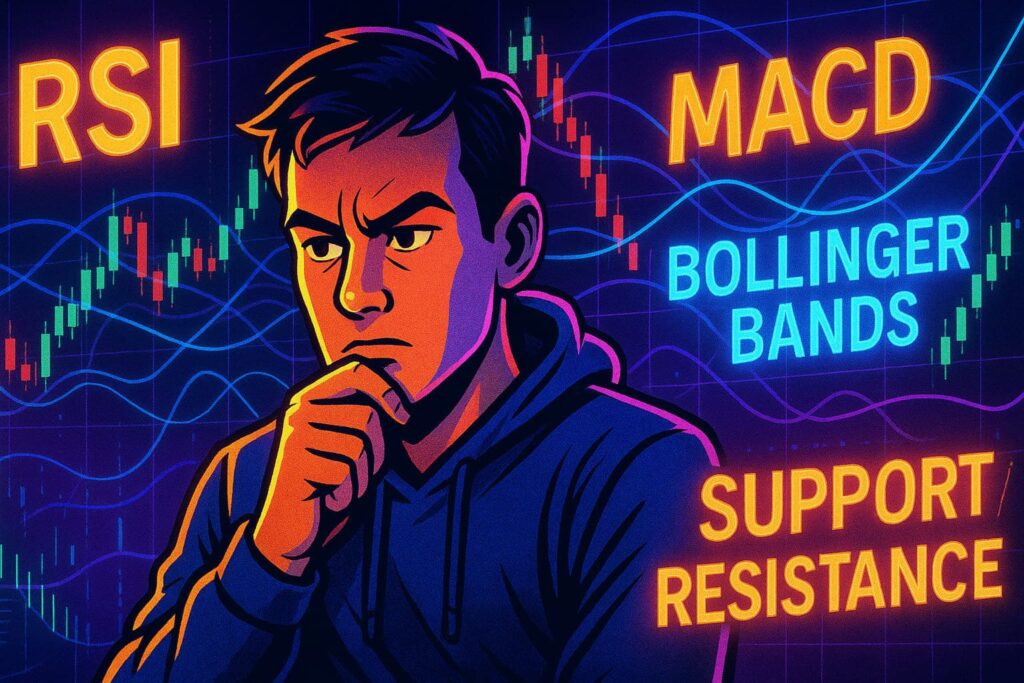


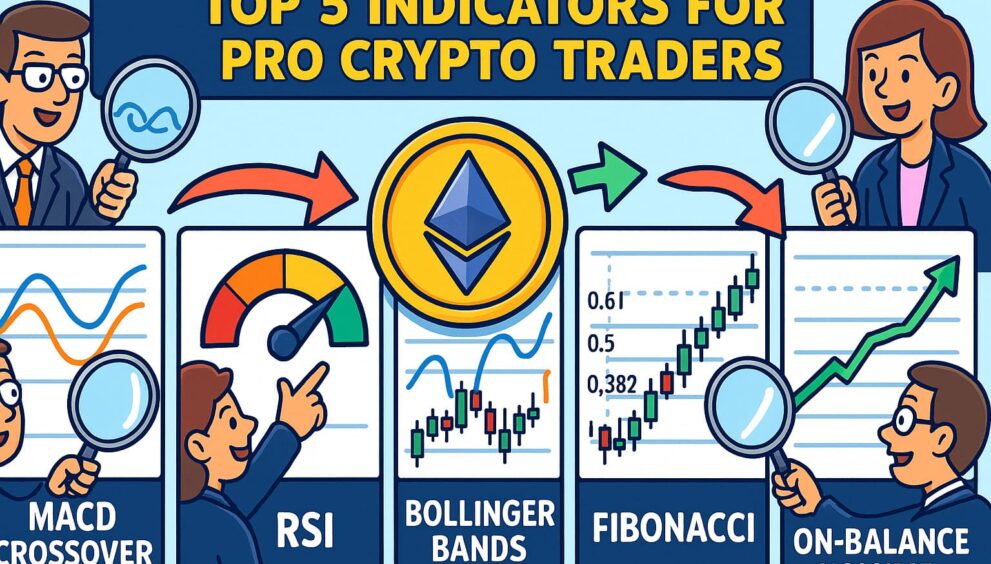
Top 5 Indicators Used by Pro Crypto Traders in 2025
Professional crypto traders often rely on a focused toolkit of technical indicators to time entries and exits, manage risk, and confirm trend strength. Here are the top 5 indicators used in 2025—powerful, time-tested tools that complement your strategy.
Moving Average Convergence Divergence (MACD)
MACD combines two exponential moving averages—typically 12-period and 26-period—to derive a trend and momentum line. A 9-period EMA of that difference forms the signal line.
- Bullish crossover occurs when the MACD line crosses above the signal line.
- Bearish crossover is the opposite.
- Divergence between MACD and price can indicate potential reversals.
MACD helps confirm trend direction and momentum shifts for both swing and intraday traders.
Relative Strength Index (RSI)
RSI measures momentum on a scale of 0–100, based on average gains and losses over a set period (often 14 bars).
- Values above 70 suggest overbought; below 30 suggest oversold.
- Divergences between RSI and market price often precede trend reversals.
RSI serves as a quick gauge of momentum exhaustion and trend strength.
Bollinger Bands
This volatility-based indicator consists of a central moving average and upper/lower bands two standard deviations apart.
- Narrow bands indicate low volatility (“squeeze”) and often precede big moves.
- Price touching upper band suggests overbought; lower band signals oversold.
Traders use band behavior to anticipate breakouts and mean reversion. Reddit
Fibonacci Retracement Levels
These horizontal lines identify potential support and resistance based on recent high-to-low swings—commonly at 23.6%, 38.2%, 50% and 61.8%.
Traders use them to anticipate reversal zones, entry points during pullbacks, and profit targets.
On‑Balance Volume (OBV)
OBV tracks cumulative volume, adding on up days and subtracting on down days.
- A rising OBV with rising price confirms buying pressure.
- Divergence between OBV and price may signal a weakening trend.
OBV helps validate whether price moves are supported by volume-driven sentiment.
How to Combine These Indicators
- MACD + RSI combo: Use MACD for trend confirmation and RSI for momentum extremes.
- Bollinger Bands + RSI: When price touches band and RSI confirms overbought/oversold, it can signal mean reversion.
- Fibonacci retracements: Use retracement levels with MACD or OBV confirmation to time entries.
- OBV for trend validation: Confirm rising OBV with rising price before entering a long position.
Example Strategy: Swing Trade Setup
- Identify a pullback into a Fibonacci retracement zone.
- Confirm RSI is not overbought (e.g. between 40–60).
- MACD line crosses above its signal line.
- OBV is rising to confirm increasing volume.
Enter long with stop-loss just below recent swing low and exit near next resistance or upper Fibonacci level.
Summary
The top technical indicators used professionally in crypto trading remain: MACD, RSI, Bollinger Bands, Fibonacci Retracements, and On‑Balance Volume. Used wisely, these tools help professional traders gauge trend direction, momentum, volatility, and sentiment. Matching them with proper risk controls and practice gives you a solid foundation to trade smarter and more effectively.